Algorithmic trading is stepping into a new phase
In fact, the future of algorithmic trading no longer hinges on historical data.
Artificial intelligence is accelerating the development of quantitative strategies and trading algorithms. The real challenge now is to demonstrate their robustness in the face of markets that have never existed before.
This trend is evident at the intersection of two rapidly growing markets:

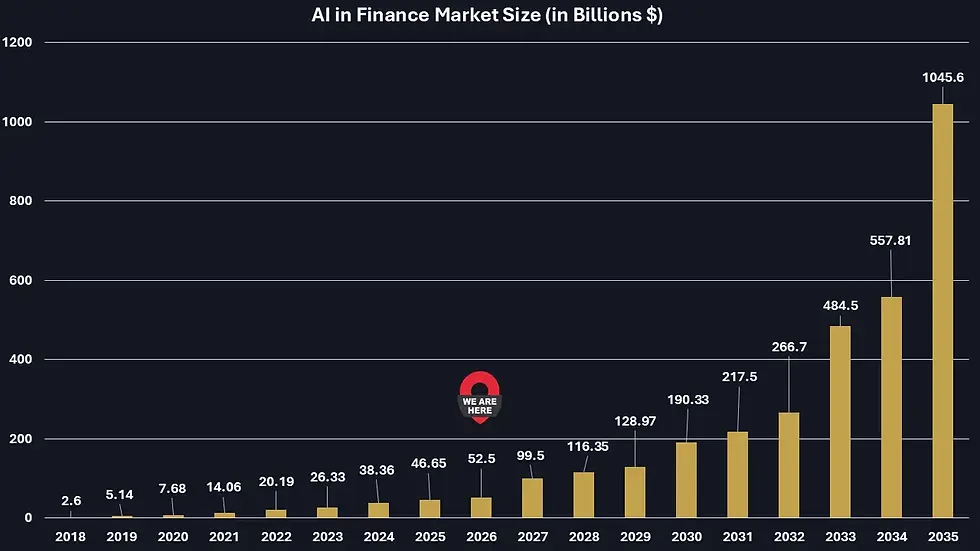
Thus, The number of models is growing faster
than the methods available to validate them
Every new strategy increases the risk of overfitting, false positives, and reliance on historical data.
Historical data describes only one past. A traditional backtest evaluates an algorithm only against events that were actually observed.
What the industry does:
-
Historical backtesting
-
Walk-forward testing
-
Monte Carlo simulation
-
Bootstrap
-
Fixed-window validation
The result is:
-
Overfitting
-
False sense of robustness
-
Limited scenario diversity
-
Difficulty in covering unseen markets
-
Limited generalization
« Testing an algorithm solely on past data is like training a pilot in only one type of weather. »

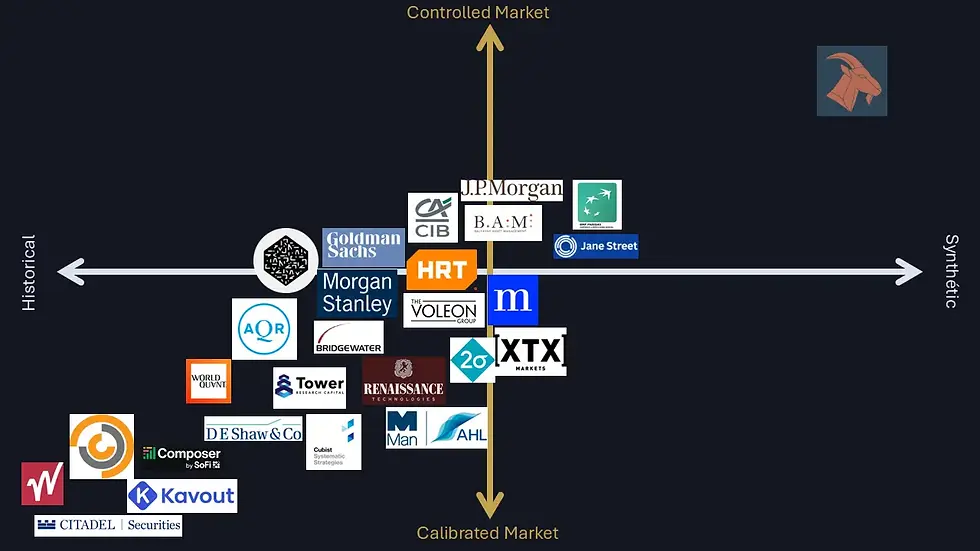
Why Traditional Approaches Have Reached Their Limits, but not CAPRINIOS
Generate synthetic markets, not just data
Caprinios develops synthetic markets designed to replicate the actual functioning of financial markets. Our approach is not simply to generate data series, but to recreate a coherent market environment that faithfully reflects the mechanisms observed in real-world trading.
Synthetic markets that accurately reflect the microstructure of financial markets
The generated scenarios replicate the dynamics of transactions at the bid-ask level, while preserving the essential properties of financial market microstructure: price formation, liquidity, volatility, and interactions between orders.
Each market is entirely synthetic but designed to closely mimic the behavior of a real market. Unlike traditional data generation methods, our technology minimizes the statistical artifacts that typically give away artificial data.
Fully controllable market scenarios
Each generation is driven by a specific set of specifications. You can replicate historical behavior, simulate a particular market condition, or explore novel scenarios that align with your research, development, or validation assumptions.
This capability enables the generation of synthetic markets tailored to demanding use cases, such as the development of trading algorithms, robustness testing, risk simulation, or the training of artificial intelligence models.
Measurable compliance across every generation
Each generated market is accompanied by a detailed report assessing its compliance with the constraints defined beforehand. Statistical, dynamic, and behavioral properties are measured to ensure that the generated scenario aligns with the established objectives.
Caprinios’s goal is to preserve the fundamental characteristics of financial markets while reducing the presence of detectable synthetic signatures, thereby providing more realistic, reliable, and actionable data for quantitative research and industrial applications.

Our Key Figures
2 253
Created scenarios *
+15
Customizable
settings **
+100%
Additional
robustness ***
23
Implemented
research papers ****
* +2,253 custom scenarios have been created
** +100% additional robustness in AI trading bot risk management
*** +15 customizable parameters to create the scenarios you need
**** 23 research papers have been implemented in the CAPRINIOS Synthetic Market solution
Choose CAPRINIOS
What the industry does:
-
Historical backtesting
-
Walk-forward testing
-
Monte Carlo simulation
-
Bootstrap
-
Fixed-window validation
The result is:
-
Overfitting
-
False sense of robustness
-
Limited scenario diversity
-
Difficulty in covering unseen markets
-
Limited generalization
2 253
Created scenarios *
+15
Customizable
settings **
+100%
Additional
robustness ***
23
Implemented
research papers ****